PAGA Coverage Study
Request A Demo Today
Please do not hesitate to contact us if you have any queries.
PAGA Coverage Study
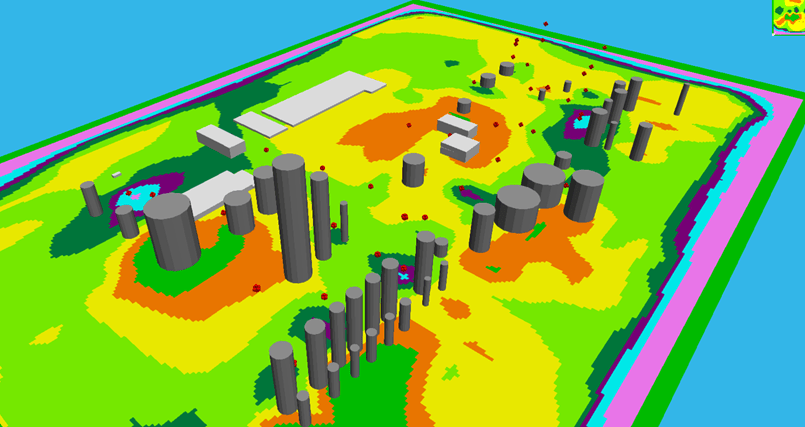
Our engineers are acutely aware of the importance of building a reliable, fail-safe, and highly intelligible PAGA system. The selection and placement of loudspeakers are meticulously planned by qualified and competent sound experts. You will enjoy a quality system that will produce high speech intelligibility over the entire facility. Using state-of-the-art computer modelling software to predict the surrounding ambient noise and reverberation effects of nearby structures. Our renowned capability in providing the most comprehensive coverage study for PAGA has put us at the forefront of the competition.
Objectives
- Perform acoustic study in full compliance with the industrial Standard
- Identify potential sources of high ambient noise and determine the correct position of field equipment for PPS within the plant area and perform noise mapping.
- Verify and evaluate the existing speakers’ sound coverage for PPS and identify the non coveredarea in the plant area as per the latest approved plot plan to ensure that personnel in the intended reception area can receive and recognize an alert and voice message.
- Based on existing speakers’ sound coverage analysis, provide optimum speaker location and quantity to achieve optimum and proper sound coverage as per industrial standards and industry best practices.
Method of statement
- Before conducting the site survey collect all the necessary drawings and documents such as plant layout drawings, existing speaker position drawings, speaker installation height, tilt, azimuth, etc.
- Identify the actual position of the plant layout drawing and measure the average ambient noise using an accurately calibrated dB Meter.
- Repeat the average ambient noise measurement and plot the measured noise in the layout drawing. Take the more dense measurement in highly noisy areas.
- Identify nearby acoustic obstacles such as structures, buildings, tanks, etc. , and measure its typical height. Record the identified obstacles and its type, height, etc in the plant layout diagram.
- Verify the existing speakers’ location and its azimuth, installation height , etc with the given details
- Gather all other related informations like average ambient temperature, humidity, wind direction & speed, and existing structure elevation.
- Transfer the plant layout diagram into CadnaA tool along with the details of the obstruction such as building, tanks, structures, and its typical height CadnaA tool.
- Transfer the existing speaker details such as its position, spear power, installation height, tilt, and azimuth to the CadnaA tool.
- Transfer the measured average ambient noise details to the cadnaA tool.
- Simulate the CadnaA tool for the average ambient noise plot and save the result to the grid, Simulate the CadnaA tool for the existing speaker coverage plot and save the result to the grid.
- Simulate the CadnaA tool for Auditability by performing the arithmetic operation and saving the result to the grid. Compare the generated auditability plot with SEC, NFPA, and ISO standards, and its requirement. If the result is not meeting the SEC, NFPA requirement, simulate the CadnaA tool by changing/adding speakers and its position to get optimum coverage to the entire EG2 area.
Ambient Noise Monitoring Equipment
Extech 407730 digital sound level meter was utilised for the measurements. The sound meter can measure sound pressure levels varying from 40dB to 130dB maximum with an accuracy of 2 dB. It supports both A weighted and C weighted measurement, fast and slow response, Max hold capture for heights reading and graphical display. The sound level meter was calibrated regular period of intervals.
The ambient noise measurements were carried out in an approximate grid format in order to establish the spatial variation of noise levels in each plant area. The measurement grid resolutions of ambient noise measurement were varied based on the ambient noise level and density of equipment deployed. Where ambient noise levels ranged from 55 – 70 dB(C), noise measurements were taken at approximately 30 metre intervals. Where ambient noise levels were higher than 75 dB(C), noise measurements were taken approximately 20 metre intervals. The ambient noise levels measured in the EG2 plant area ranges from a minimum of 70 dB(A) to a maximum of 103 dB(A).
Tool we use for modeling

What are included in our report
In order to establish the operational coverage of the in-plant paging system within the EG1 plant area, the internationally recognized noise modelling software ‘CadnaA’ has been utilized. CadnaA meets the requirement for Quality Assurance of software for the calculation of sound outdoors according to DIN 45687 and ISO 17534 series.
CadnaA is perfect tool for design of Public Address and General Alarm (P.A.G.A.) Systems in industrial sites or even dams, where certain noise levels must be assured. Such a project needs specific requirements:
- First, verbal announcements and alarms transmitted via the loudspeakers shall have a sound pressure level above background noise for a defined value.
- In addition, as specific loudspeakers are used, the sound pressure level at the listener should not be greater than a defined level above the background noise to avoid hearing problems to the listeners.
- Paging system Modelling and Assumptions
The following input data are used for acoustics modelling of the in-plant paging system.
Average Ambient Noise Analysis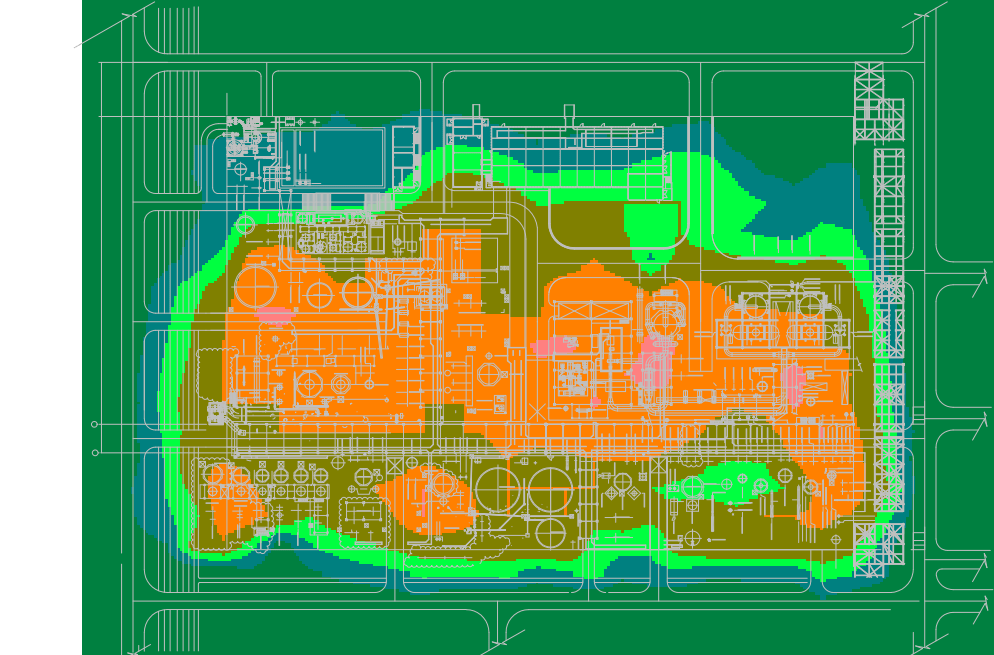
In Ambient noise analysis, as mentioned Method of statement, all the measured actual noise is transferred to the CadnaA tool. Simulated output is saved to the grid. This ambient noise grid map is used for Auditability by performing the arithmetic operation. The simulated output of the average ambient noise measured is shown In the figure
Speaker Sound Propagation Analysis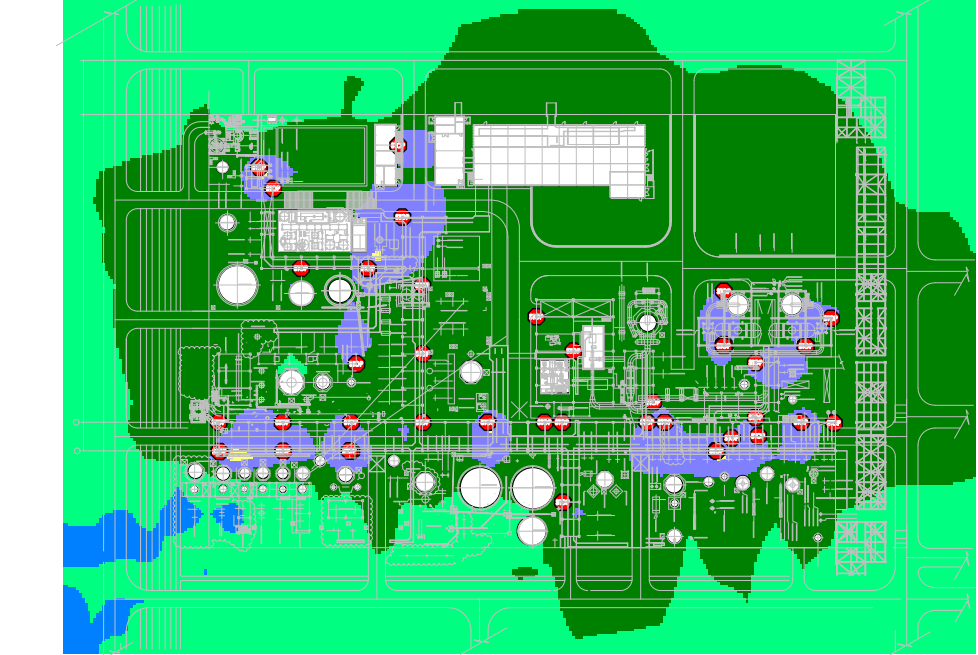
In this stage, existing speaker details such as Speaker power, octave band, installation height, azimuth, tilt; and obstructions such as buildings, structures, tanks; and reflection parameters, ground absorption coefficient, meteorological data etc. are transferred to the CadnaA tool. The grid map calculation was then carried out at a resolution of 5 meters to simulate the approximate sound levels achieved by the speakers in the study area. The simulated output for speaker sound propagation is saved to the grid and is depicted in the figure
Auditability (Coverage Analysis)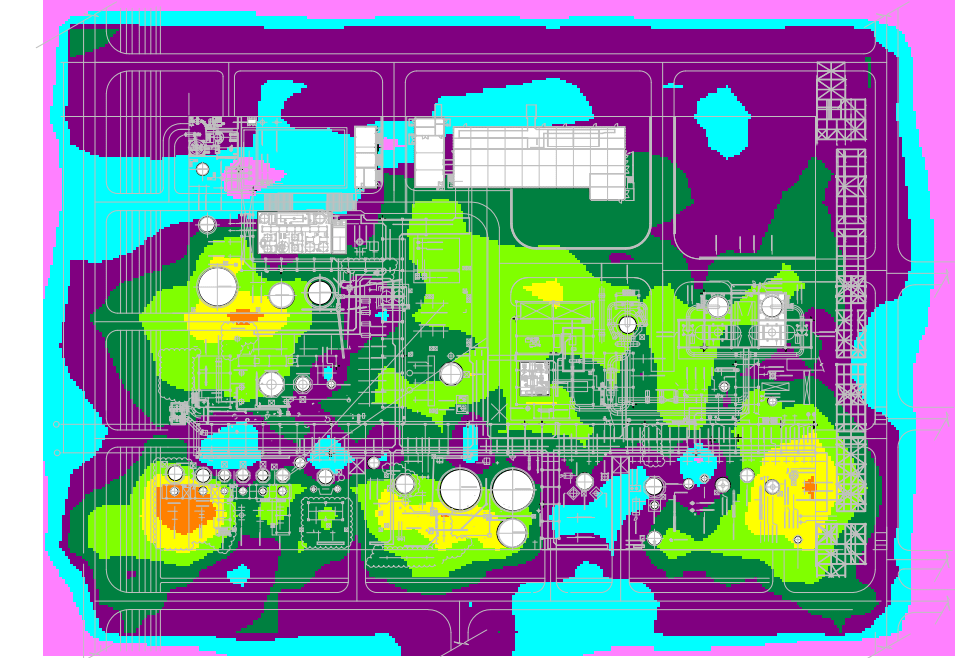
In this stage, CadnaA uses the two previously simulated outputs (Speaker sound output and average ambient noise output) and perform arithmetic operation. The result of the arithmetic operation gives auditability, as shown in the figure.
ACOUSTIC COVERAGE STUDY
Aarmtech Acoustic study service is available to enable the project to predict broadcast system performance. The study is executed based on a site survey, where actual broadcast versus ambient noise sound pressure level readings are recorded and mapped onto area plot plans. For green field sites, the acoustic coverage study can be implemented from data derived from ambient noise predictions. In either case, the field equipment is then specified in terms of type, quantity, orientation, frequency response, and power output.
The System performance criterion includes intelligibility of speech, speech/alarm tone audibility, and broadcast clarity, in each case with the coverage area envelope defined by the client.
In order to execute an acoustic study we require some basic information from the client:- Scaled plot plan and elevation drawings generated in Auto CAD, area classification i.e. Safe area, zone 1 and zone 2 potentially explosive hazardous area, performance basis for study – Broadcast audibility and/or intelligibility. The coverage envelope required detailing escape routes, muster areas, and critical locations. Finally, ambient noise predictions for each area of the site can be in the form of contoured maps, spreadsheet analysis, software-generated files, or spot ambient noise data given at strategic locations. Where the client has no knowledge of the ambient noise then Aarmtech is able to deliver a solution based on our nominated ambient noise estimates from our extensive experience of similar sites.
Output from the acoustic study
A graphical illustration of system broadcast performance is overlaid onto the client project plot plan drawings, this shows coverage sound pressure level gradients from each loudspeaker and signal to ambient noise maps (relative levels above the ambient noise levels measured or predicted). Each device is uniquely tag numbered with the following data appended – power setting, type of loudspeaker (i.e. horn-loaded, direct radiator, explosion proof or safe area) alignment. The study considers compartment footprint and height, dividing walls, target listening area, location, and quantity of devices. A detailed report is delivered which contains the design input data, the basis for the study, rules/specifications (where applicable), and output data i.e. quantity of field devices, location, and type. The report details the predicted performance of the system and compliance with specifications/standards plus any corrective actions.
If you have any question about Acoustic study service or would like to request a quote, you can reach us by email, phone or by filling out the contact form, our dedicated team of Acoustic study will get back to you as soon as possible, We look forward to hearing from you